A Topicfinder report starts by analyzing one or more websites that you provide: one being the primary website (YourWebsite.com) and the other being a site of a known competitor (CompetitorWebsite.com), which is an optional step.
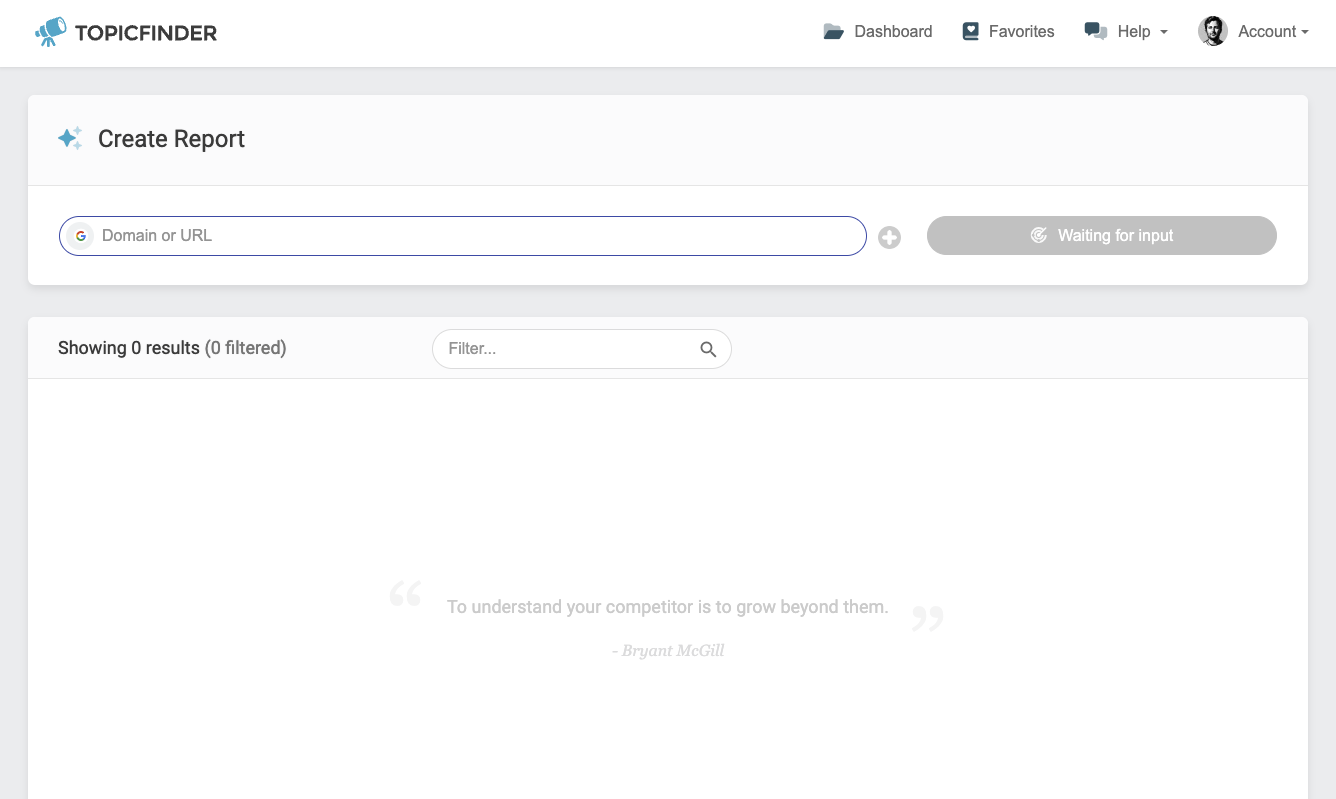
From this, the software identifies hundreds of other websites that are very similar to yours and the competitor’s in terms of content. This process generates a comprehensive list of potential competitors.
Additionally, the software compares your website’s performance with these potential competitors, providing insights into your competitive position.
Note: For a detailed understanding of each metric, we provide a comprehensive guide in our help center specifically focused on SEO metrics.
![]()
Here’s an example filter that only shows results with a minimum SEO Viability Score of 50, a minimum Traffic Share Percentage of 1%, and a Domain Authority range of 1 to 30 max.
From this, we’re able to narrow nearly 10,000 results down to 15 that meet our very specific criteria. These are all high traffic topics from very small websites, and they should all be relatively easy to rank for. Nice!
Saving Your Favorite Topics and Using Them
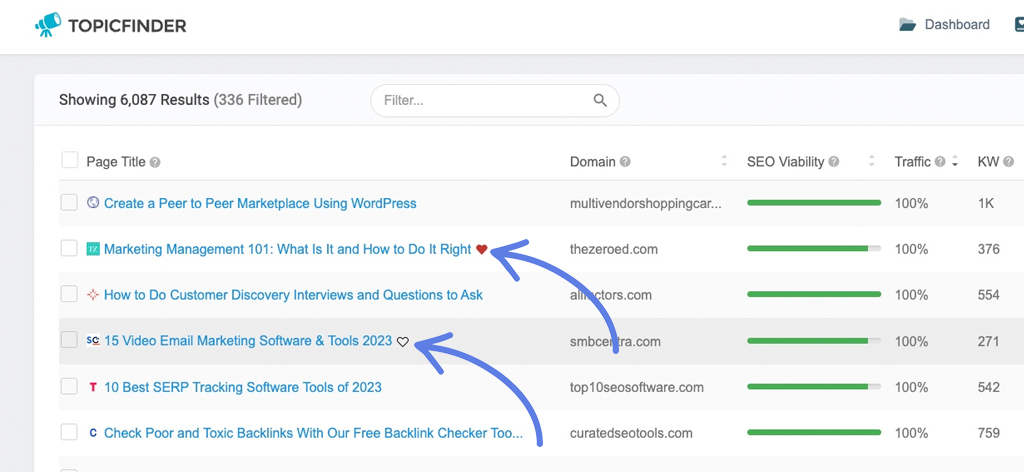
Once your report is done, you can start saving the topics that you like the most. Hover over a topic and click the heart icon to save it to your Favorites list.
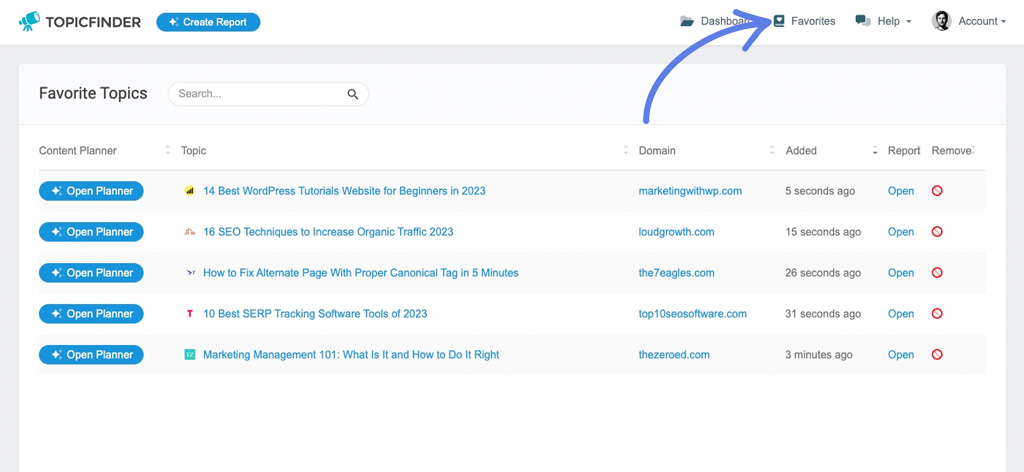
Once the topic is added to your favorites list, you can click “Favorites” in your menu to find all of your favorited topics.
The Favorites tab is also where you’ll find our AI-Powered Content Planner. Click “Open Planner” next to a topic, and our AI engine will generate variations of that title that you can use in your new article.
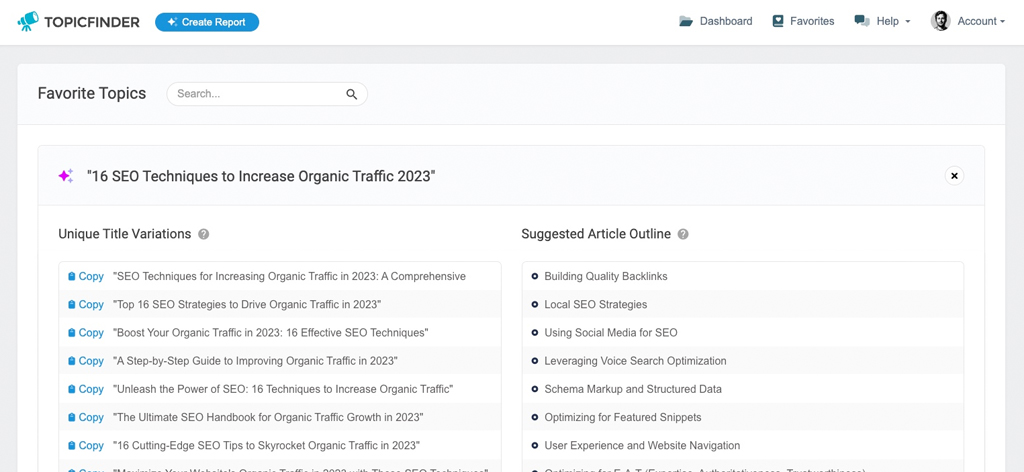
You can click “Copy” next to any of the titles to copy it to your clipboard.
We also give you a suggested article outline that you can use to structure your article. It’s like a flexible guide that helps you organize your article and highlights important sections to include. Following this outline will make your article more relevant and improve the chances of it ranking high for the chosen topic.
Sharing and Exporting Reports
Sharing results can be done one of two ways.
The first is exporting. You can click the little blue “Export” button in the upper right-hand corner, and it will open the export dialog.
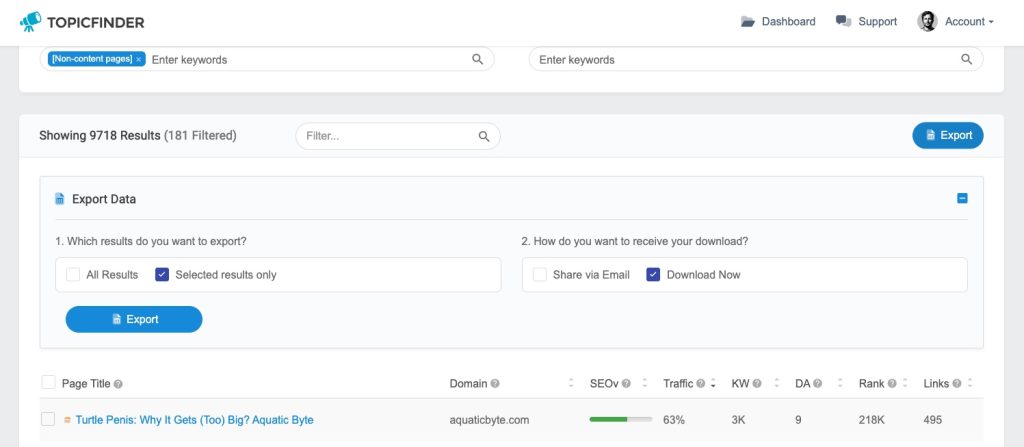
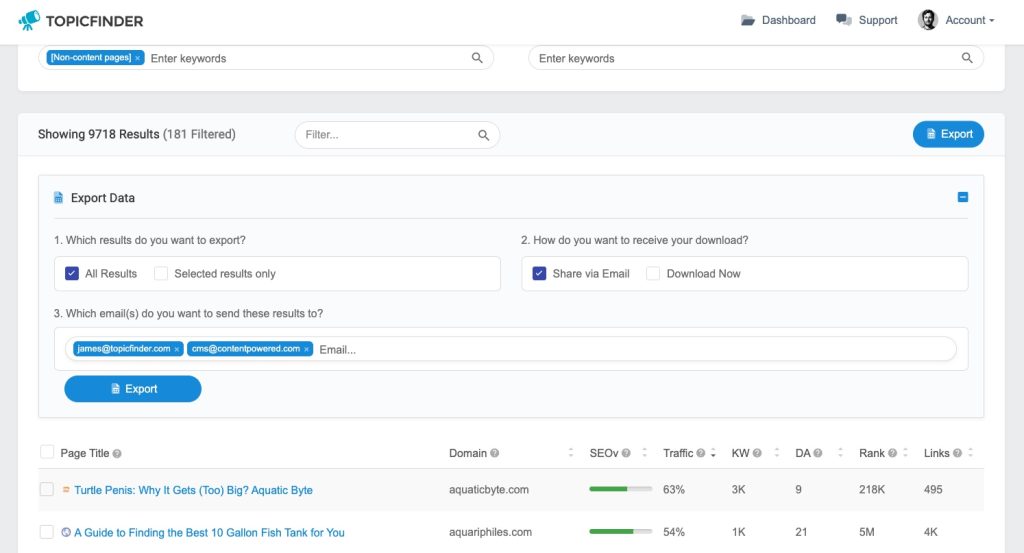
Here, you can choose if you want to export all of your results, or just the results that you have selected. For our demo, we’ll do an email report and send this to a couple of different emails.
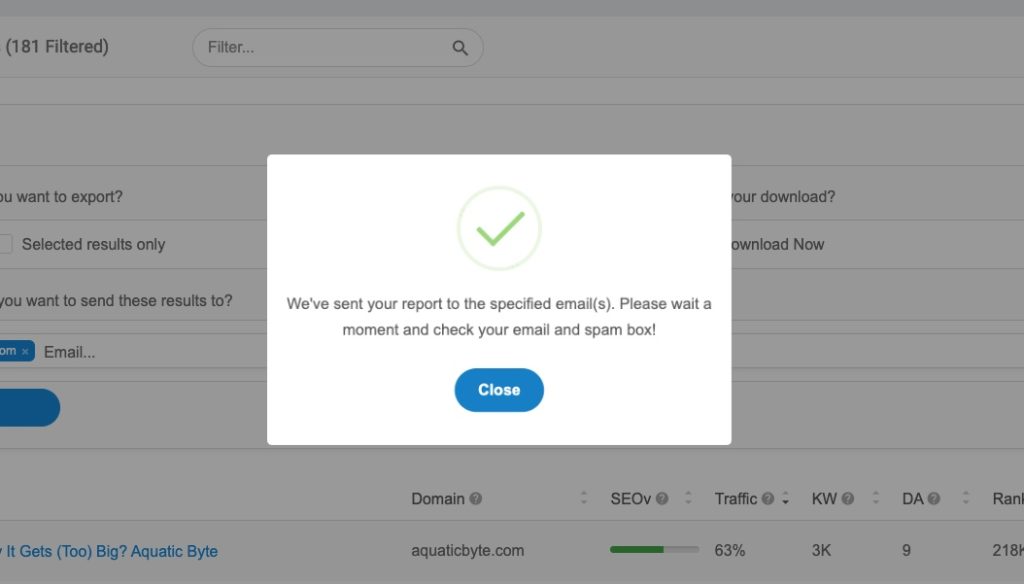
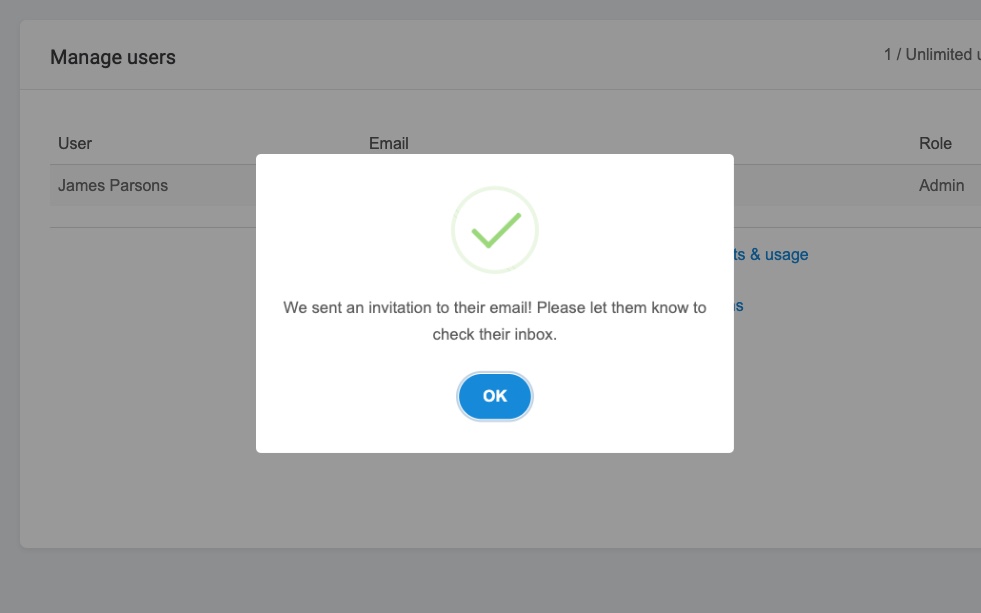
Once you’ve exported your results, you’ll see a success notification.
Then, you or whoever you shared your report with will receive an email where they can view the results from your report and use that data accordingly.

You also have the option to download a report instantly as a spreadsheet, which can be opened in Excel, Open Office, or Google Sheets.
Note: Large exports over 10,000 rows may take a bit longer to download, and will be downloaded in .zip format instead of .csv format.
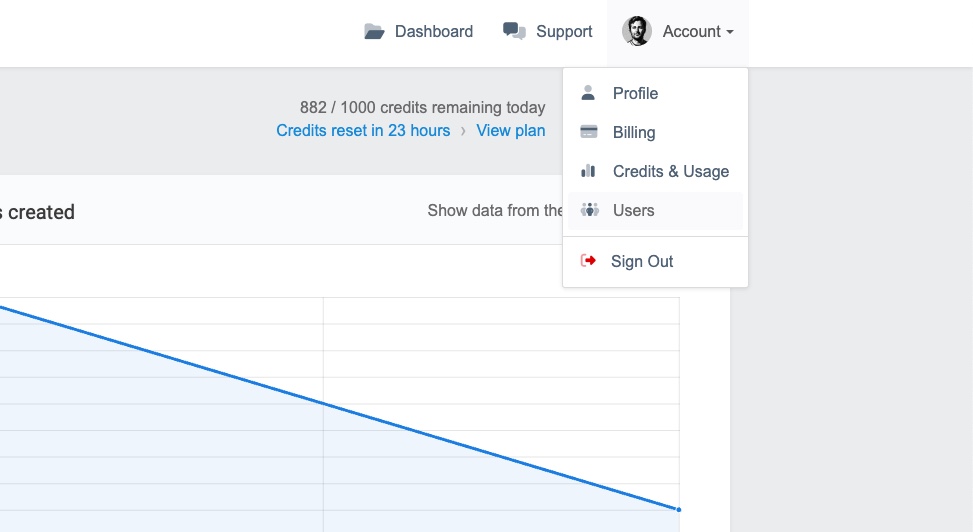
We mentioned two ways to share reports. If you want your user to be able to see the same report you are seeing instead of a spreadsheet, you should add them to your account as a user. You can reach this section by clicking “Account” and then “Users”.
In this section, you can input your team members’ email addresses, which triggers an invitation for them to join your workspace and access reports on your shared dashboard. This feature is particularly beneficial for collaboration and content teams.
You can also define their access levels, deciding whether they should have partial or full account access, the ability to add or remove users, among other permissions.
With that, we’ve wrapped up the basic tutorial, and you’ve successfully generated your first report!
There are numerous ways to utilize Topicfinder. The most effective results often come from generating multiple reports across a variety of competitors. This approach allows you to discover new aspects of your industry and identify topics with great potential to attract traffic and new customers to your business.
Note: The “Find Competitors” step consumes two credits because it involves scanning two domains (websites) to compile a comprehensive list of potentially hundreds of competitors.
Adjusting Your Report Size
Topicfinder operates using a credit system. These credits can be allocated towards generating reports. The distribution of credits is entirely your decision.
For example:
- If you require 10 concise reports, you can allocate a fewer number of credits for each report.
- On the other hand, if a massive, in-depth report is what you’re after, you can opt to use your entire day’s quota of credits on that single extensive report.
- Or, you can create a few medium sized reports.
- Or, you can create dozens of micro reports.
The following step allows you to make this choice. Additionally, it provides options to refine your search in various ways to enhance the relevance of your results. We’re about to delve into this process in more detail.
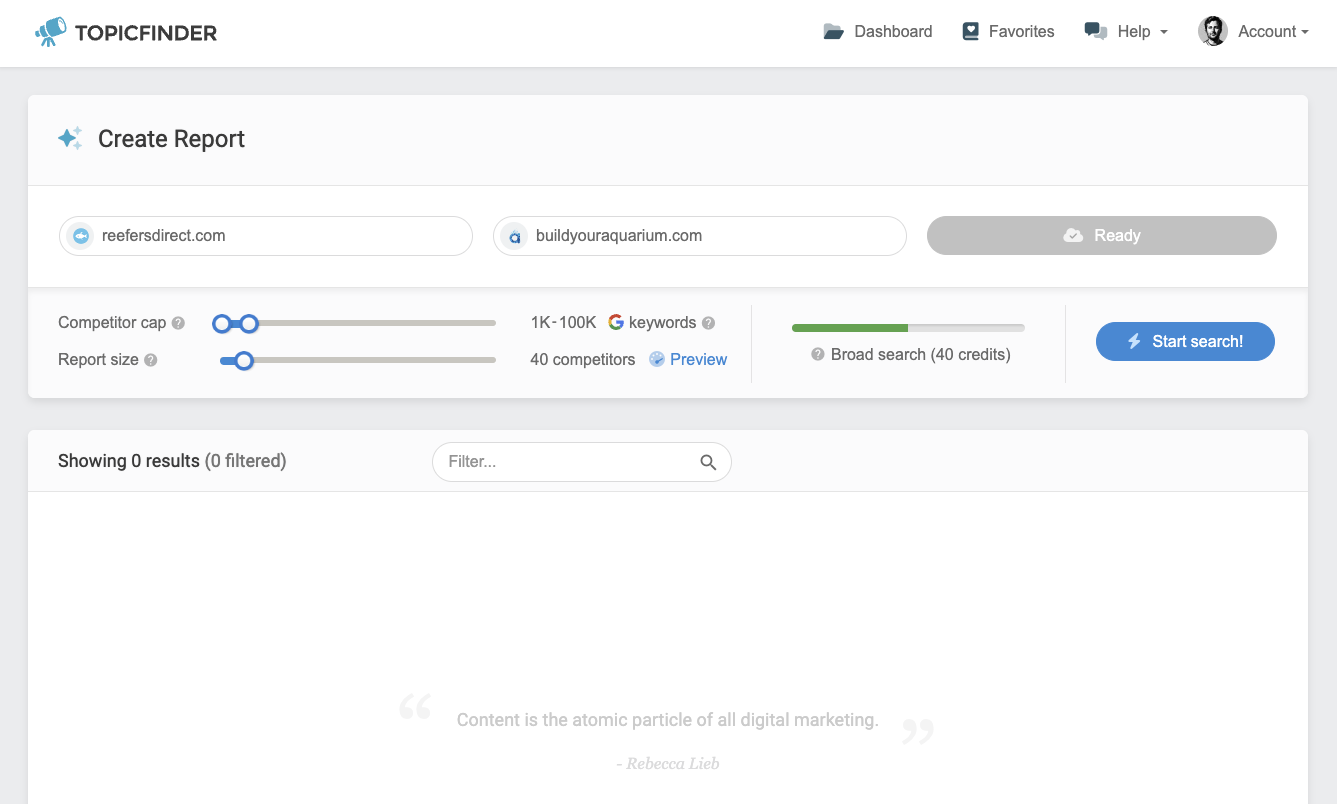
You’ll see a few options: Competitor size, Competitor Limit, and Fine-tune.
- Competitor cap. The feature to limit your competitor search based on their estimated monthly traffic is useful for focusing your research on similarly-sized websites. Let’s say your website has around 50,000 visitors each month. By adjusting the slider to a maximum of 50,000 visitors per month, the search will only consider competitors with a similar audience size. This way, you won’t expend credits investigating much larger websites or attempt to rank against websites substantially bigger than yours.
- Report size. This lets you adjust the overall size of your search. If you only want to spend 50 credits on a report, you can set this to “50 competitors”, and it will use one credit per competitor, or 50 credits.
The “Preview” feature, while optional, can be particularly beneficial for advanced users. It allows you to preview the identified competitors before you allocate credits for detailed research:
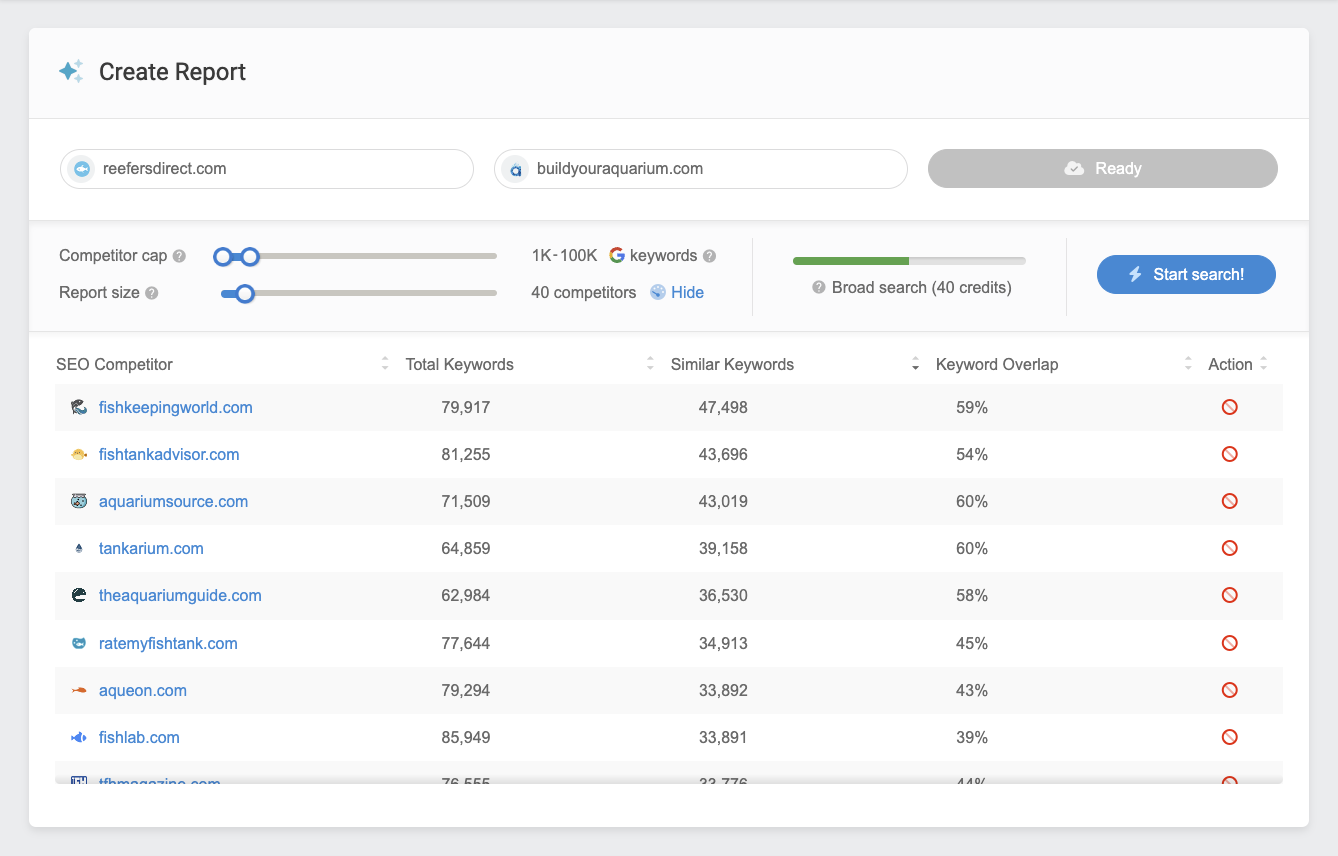
If there are competitors on this list that you’re not interested in, you can easily remove them by clicking the ‘Delete’ button in the right column. Doing so not only removes the competitor from the search, but also reduces the cost by one credit.
You can modify the search parameters using the sliders, and watch as the table updates in real-time with new potential competitors.
Once you’re satisfied with your curated list of competitors, you’re all set to initiate your search!
Starting Your Report
After initiating your search, your report is started and you’ll start to see new results filling into view.
You don’t have to hang around for it to finish – unless you want to. You can leave to your dashboard, and see the report and it’s current status from there:
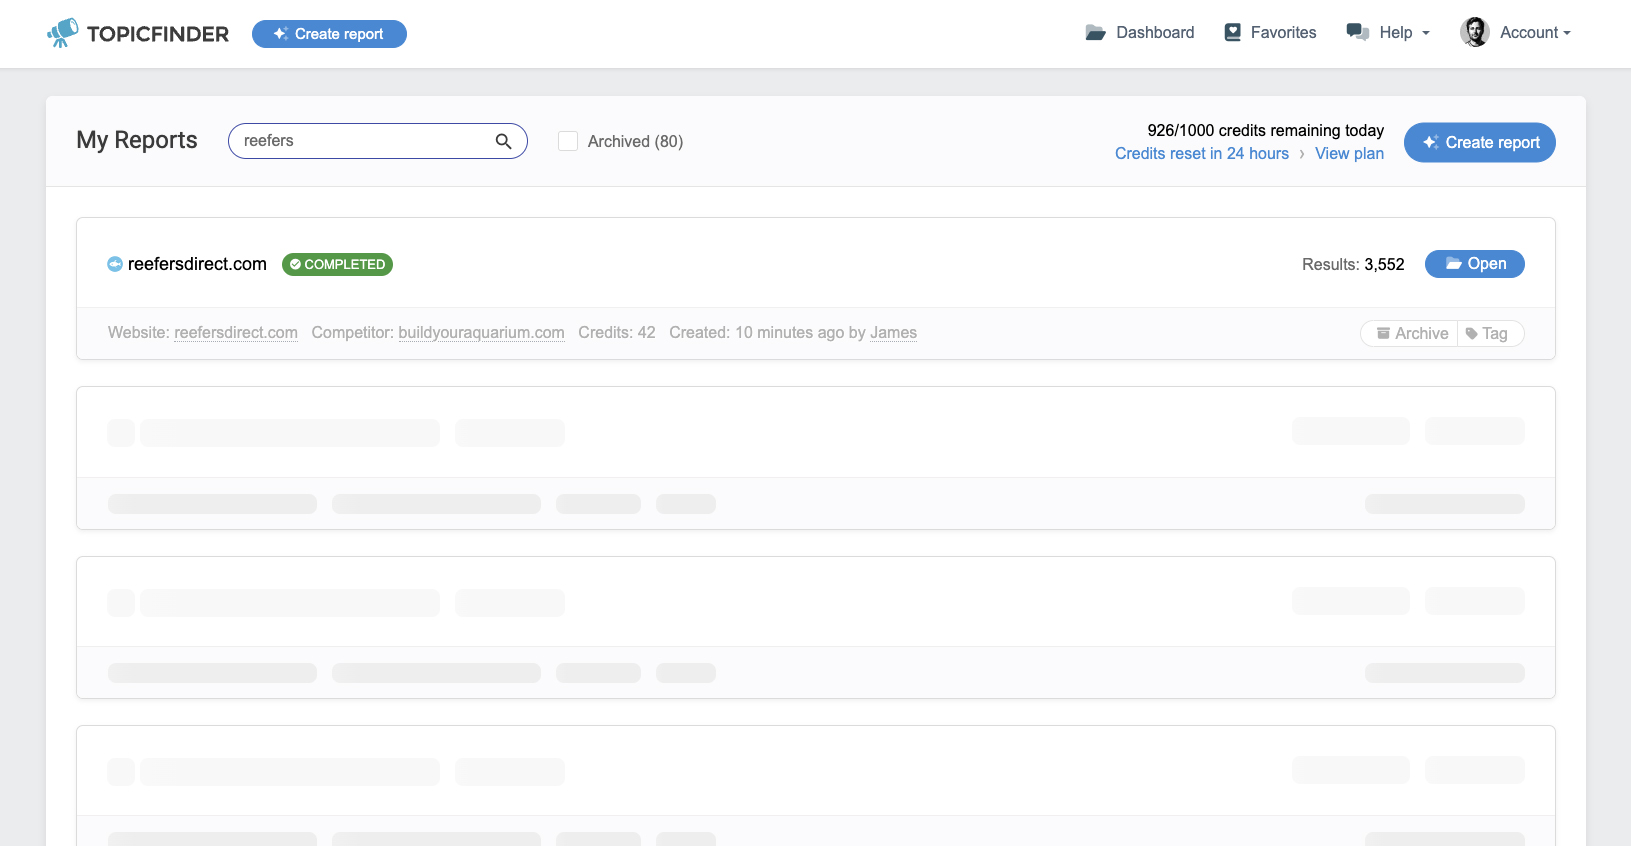
We typically find anywhere from 30-80 results per second. So with a report of around 50 credits spent, looking at approximately 5,000 results, you can expect this report to be completed within a few minutes.
You can also start multiple reports at once, and come back later when they are finished.
Note: Some features, like selecting and exporting specific rows, may be challenging to do while the report is running. The table is constantly being adjusted with new results pouring in, which can make it tough to quickly select your rows without the table moving. It’s best to wait until the report is completed before selecting or exporting the results.
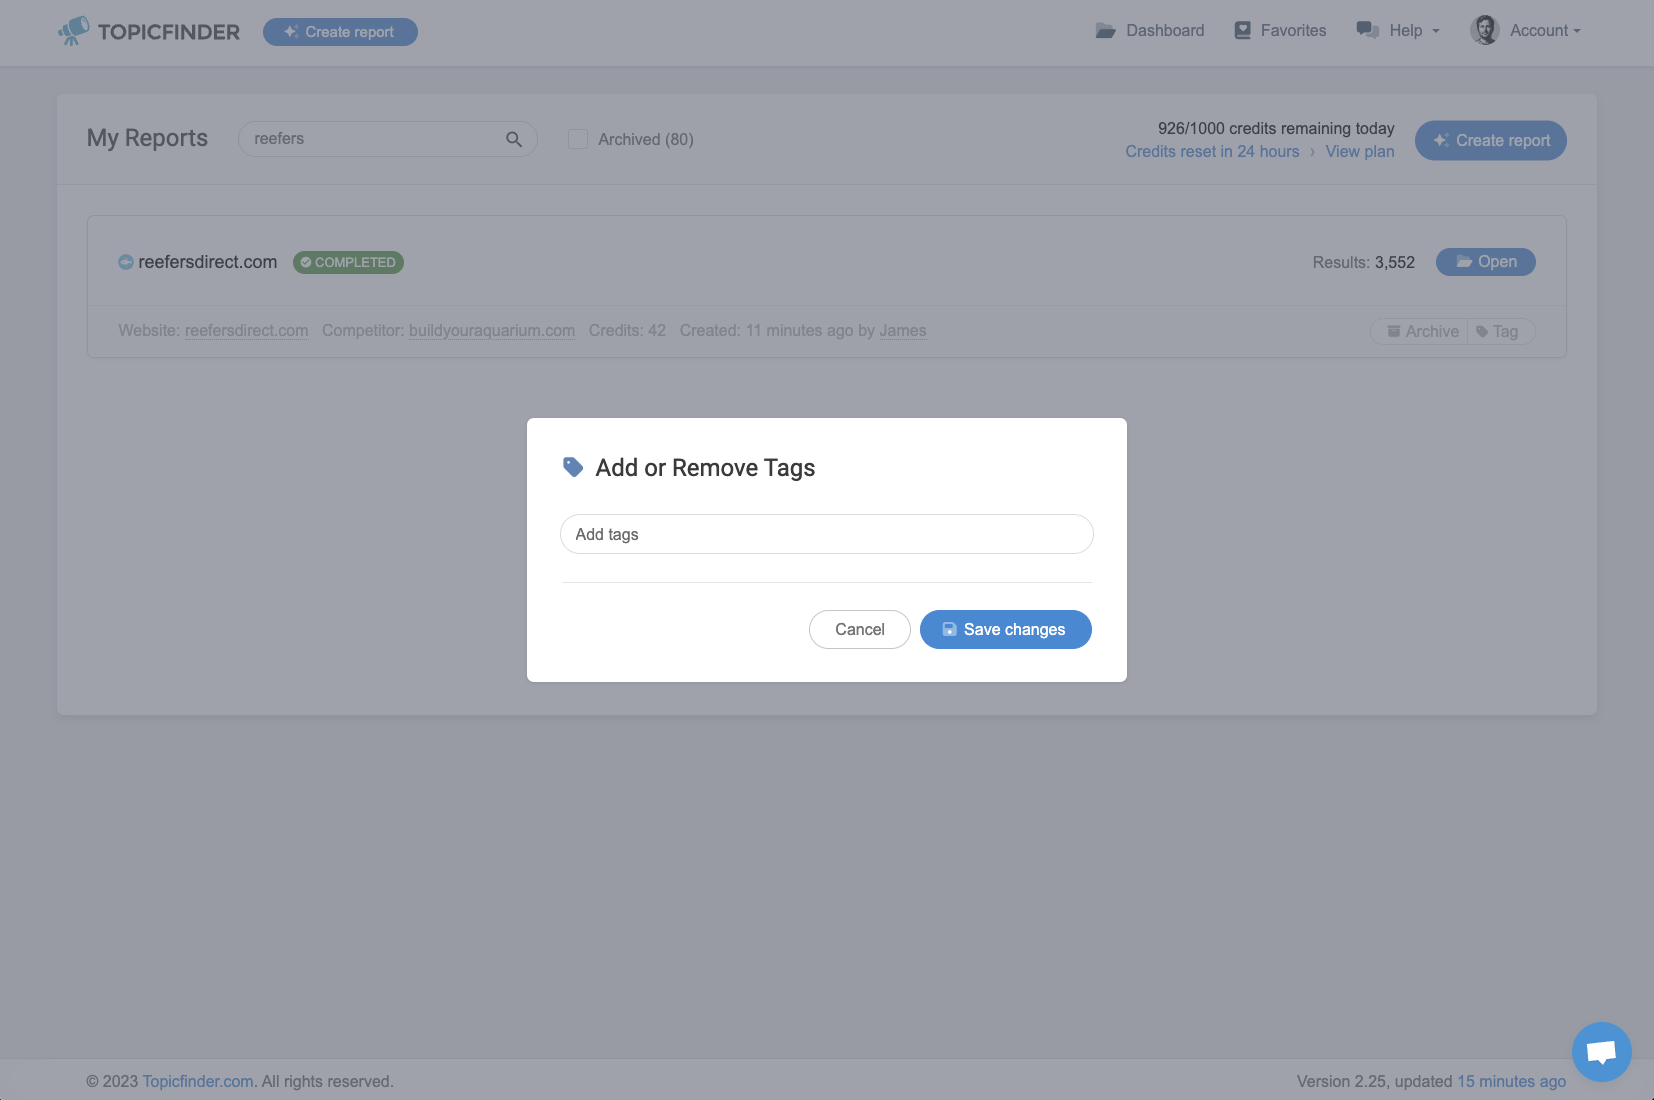
This is also a good opportunity to tag the report on your dashboard for easier identification. You might want to name it based on the client or website you’re investigating, or any other term that would be useful for future reference and searches:
Now that our report is done, let’s click “Open” and take a look:
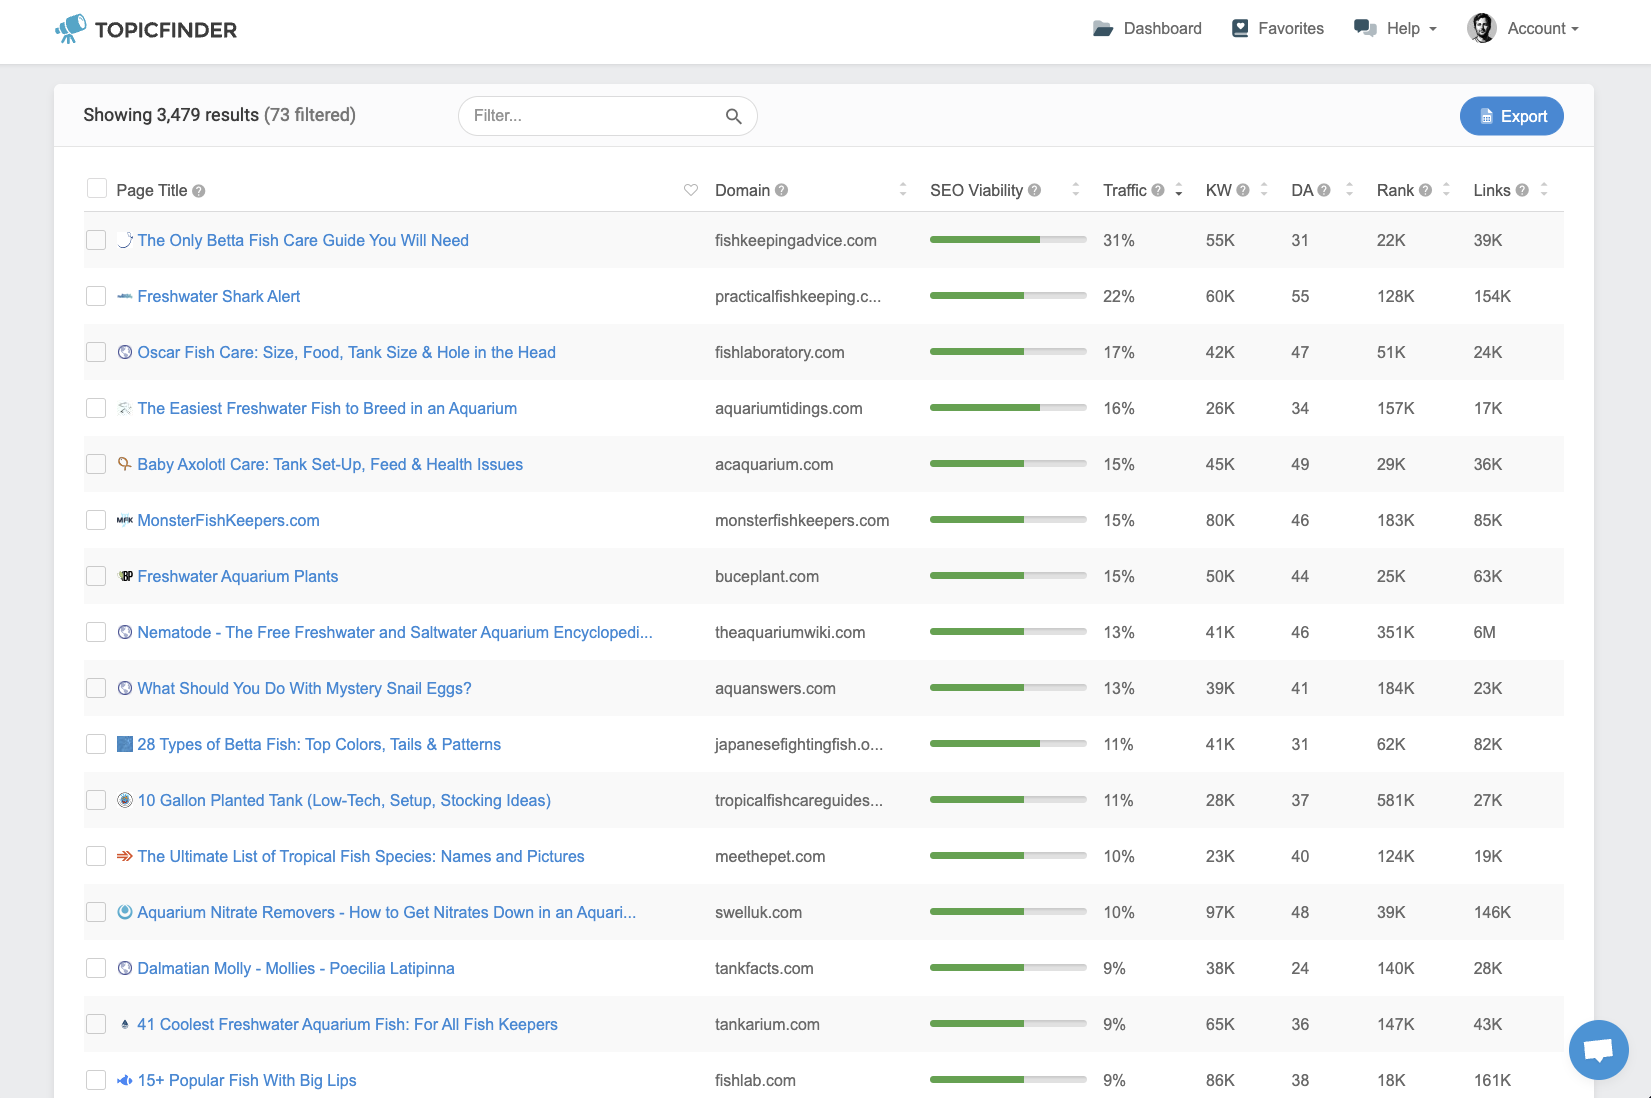
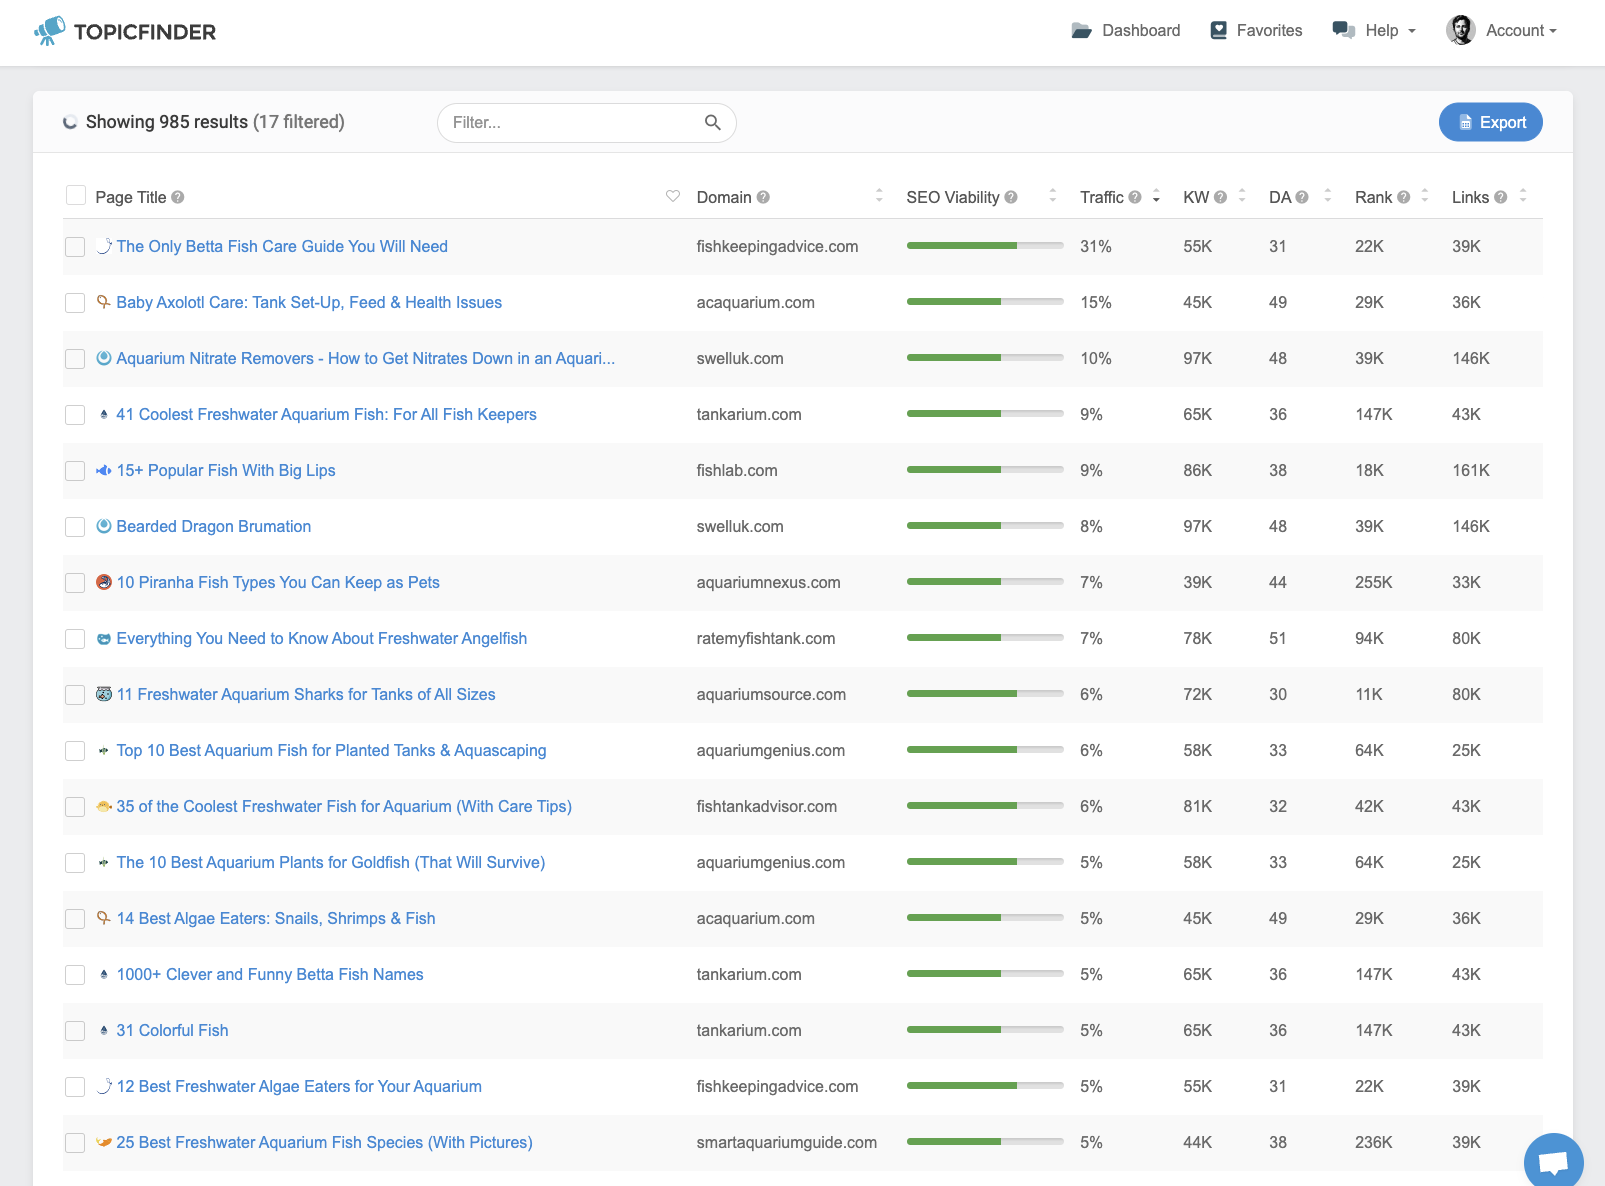
Here are the generated results. By default, we arrange the data on the dashboard starting with the pages with the highest traffic volume.
This arrangement gives you an insight into the most visited pages on your competitor’s website, which often signifies their importance. Evaluating the relevance of these pages to your own strategy is your next step.
One of the most powerful tools on Topicfinder is our in-depth filters:
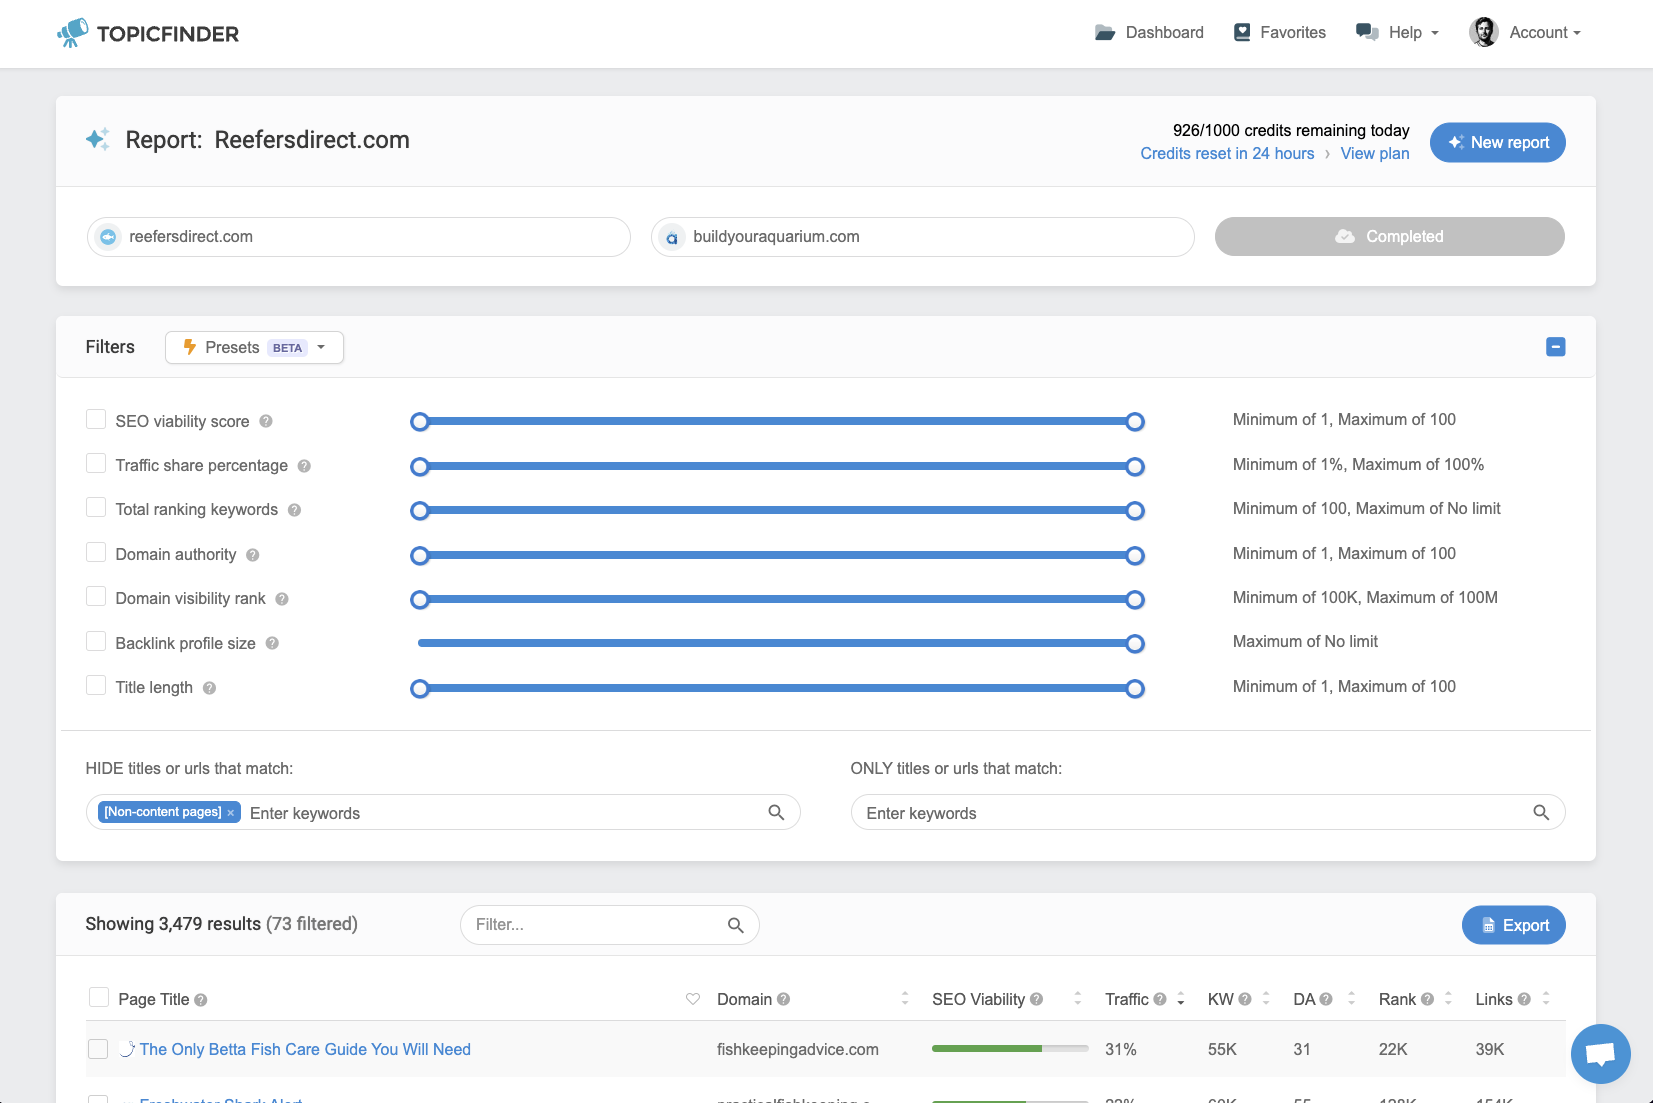
Dealing with large reports containing thousands of results can seem daunting. This is when refining your search becomes crucial.
You may choose to apply filters to display only those websites with a lower domain authority, should you be targeting easier-to-rank-for topics.
Alternatively, you might decide to narrow your search further by adding specific keywords such as “Stands”. This would then limit the results to topics specifically related to aquarium stands.
We gather data from various metrics, one of which is our unique, easy-to-understand composite metric named “SEOv”, short for Search Engine Optimization Viability. This is designed to offer a user-friendly measure of a topic’s potential from an SEO perspective.
Note: For a detailed understanding of each metric, we provide a comprehensive guide in our help center specifically focused on SEO metrics.
![]()
Here’s an example filter that only shows results with a minimum SEO Viability Score of 50, a minimum Traffic Share Percentage of 1%, and a Domain Authority range of 1 to 30 max.
From this, we’re able to narrow nearly 10,000 results down to 15 that meet our very specific criteria. These are all high traffic topics from very small websites, and they should all be relatively easy to rank for. Nice!
Saving Your Favorite Topics and Using Them
Once your report is done, you can start saving the topics that you like the most. Hover over a topic and click the heart icon to save it to your Favorites list.
Once the topic is added to your favorites list, you can click “Favorites” in your menu to find all of your favorited topics.
The Favorites tab is also where you’ll find our AI-Powered Content Planner. Click “Open Planner” next to a topic, and our AI engine will generate variations of that title that you can use in your new article.
You can click “Copy” next to any of the titles to copy it to your clipboard.
We also give you a suggested article outline that you can use to structure your article. It’s like a flexible guide that helps you organize your article and highlights important sections to include. Following this outline will make your article more relevant and improve the chances of it ranking high for the chosen topic.
Sharing and Exporting Reports
Sharing results can be done one of two ways.
The first is exporting. You can click the little blue “Export” button in the upper right-hand corner, and it will open the export dialog.
Here, you can choose if you want to export all of your results, or just the results that you have selected. For our demo, we’ll do an email report and send this to a couple of different emails.
Once you’ve exported your results, you’ll see a success notification.
Then, you or whoever you shared your report with will receive an email where they can view the results from your report and use that data accordingly.
You also have the option to download a report instantly as a spreadsheet, which can be opened in Excel, Open Office, or Google Sheets.
Note: Large exports over 10,000 rows may take a bit longer to download, and will be downloaded in .zip format instead of .csv format.
We mentioned two ways to share reports. If you want your user to be able to see the same report you are seeing instead of a spreadsheet, you should add them to your account as a user. You can reach this section by clicking “Account” and then “Users”.
In this section, you can input your team members’ email addresses, which triggers an invitation for them to join your workspace and access reports on your shared dashboard. This feature is particularly beneficial for collaboration and content teams.
You can also define their access levels, deciding whether they should have partial or full account access, the ability to add or remove users, among other permissions.
With that, we’ve wrapped up the basic tutorial, and you’ve successfully generated your first report!
There are numerous ways to utilize Topicfinder. The most effective results often come from generating multiple reports across a variety of competitors. This approach allows you to discover new aspects of your industry and identify topics with great potential to attract traffic and new customers to your business.